Economic discussions involving the U.S. and China often focus on national-level matters such as currency valuation, duties, and trade policy. Yet decisions and economic activity at the local level are immensely important, as they form the building blocks of a strong national economy. This analysis therefore takes nominal gross metropolitan product (GMP) data from the eight most productive Chinese cities from 2009, the last year for officially reported data, and compares it to 2009 GMP data from U.S. cities. The U.S. data uses the metropolitan statistical areas as defined by the OMB and used by the BEA for its GDP statistics. For the Chinese data, the National Bureau of Statistics says that “counties under the jurisdiction of city governments are included,” which we interpret as being a concept similar to the metropolitan statistical areas used in the U.S. We chose eight cities because of the number 8’s significance as a sign of good fortune in Chinese culture.
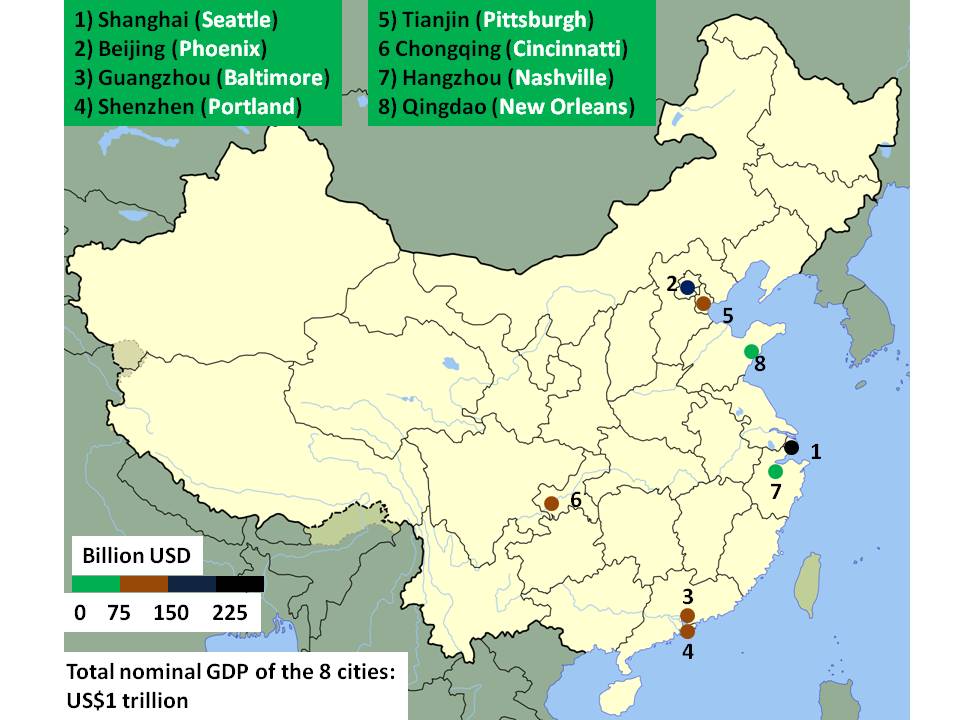
Chinese cities are growing impressively, while many of their U.S. counterparts are struggling to recover from a hard-hitting recession. In 2009, Shanghai’s US$221 billion in economic output put it on par with Seattle (Exhibit 1). Based on IMF data, Shanghai’s purchasing power parity adjusted economic output in 2009 was worth approximately US$400 billion—roughly equivalent to Washington DC and larger than Dallas or Houston. In total, these eight cities accounted for slightly over 20% of China’s GDP.
Exhibit 1: Economic Output of China’s 8 Largest Municipal Economies Compared to U.S. Peers
Chinese city and U.S. equivalent city, Nominal GDP, 2009
Click on image to enlarge
Source: National Bureau of Statistics, IHS Global Insight, China SignPost™
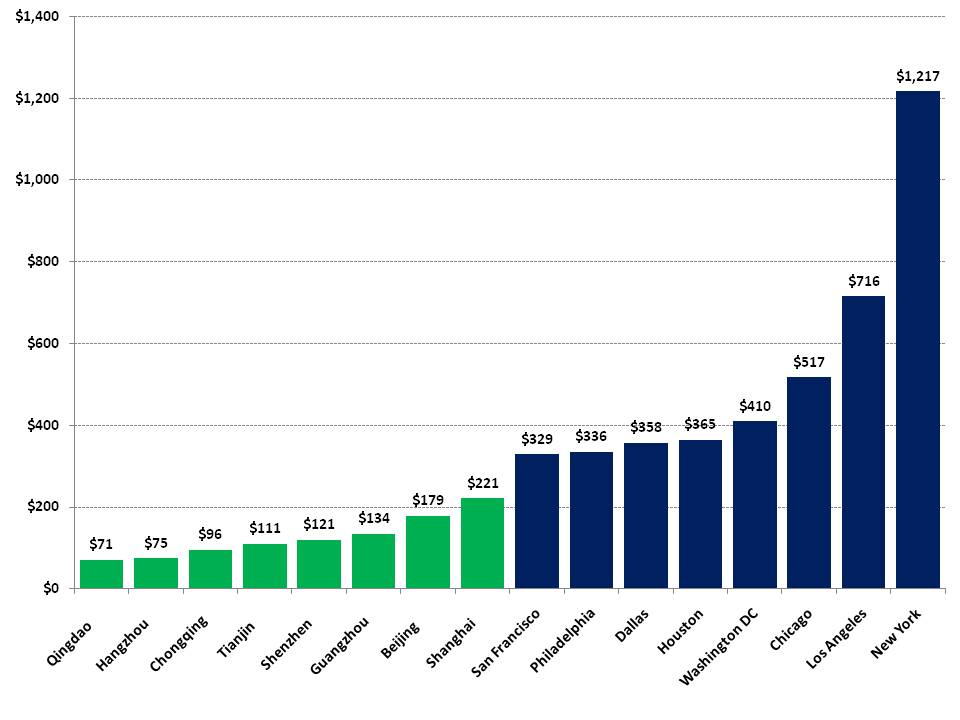
China’s eight largest cities by economic output still trail their U.S. peers by a substantial margin in nominal GMP terms, with the largest output Chinese city, Shanghai, trailing the 8th-largest U.S. city, San Francisco, by nearly 50% in 2009 (Exhibit 2).
Exhibit 2: GMPs of the most productive Chinese and U.S. cities
Billion USD, Nominal GDP, 2009
Click on image to enlarge
Source: Bureau of Econ. Advisors, CIA World Factbook, IHS Global Insight, China SignPost™
In PPP-adjusted terms, Shanghai would be the 5th largest city of the 16, surpassed only by New York, Los Angeles, Chicago, and Washington DC. A key point to note here is that in nominal terms, the New York Metro GMP was five and a half times larger than Shanghai’s in 2009 and in PPP-adjusted terms remained three times larger. In short, while Shanghai is clearly a major and fast-growing global economic center, it is far from matching or surpassing New York, the economic superpower among world cities.
Moreover, the urban-suburban-rural divide is far more stark in China than in the U.S., so Chinese cities represent a greater proportional concentration of wealth generation and consumption. In the U.S., by contrast, suburbs and satellite communities are often economic engines and areas of significant wealth. Rural areas in the U.S. typically enjoy per capita incomes far above those in even the wealthiest Chinese cities, and some areas in the Midwest, West, and Southwest are further buoyed by significant agricultural, resource, and tourism economies.
The current GMP lead enjoyed by major U.S. cities over their Chinese counterparts is further accentuated when viewed in geographical context. China’s four direct-controlled municipalities—Beijing, Tianjin, Shanghai, and Chongqing—are all far larger physically than a typical U.S. city (or even a typical Chinese city). Chongqing, in particular, stands out in this regard. Perhaps the world’s most populous municipality, and one of the largest by area, at 82,300 km² (31,800 mi²) it is larger than both Hainan Island 33,920 km2 (13,100 sq mi) and Taiwan at 36,008 km2 (13,902.8 sq mi). Its closest U.S. GMP equivalent, Cincinnati, is only 206.1 km2 (79.6 sq mi), in size.
Nevertheless, the fact that 28.85 million Chongqingers and their $96 billion GMP are managed as a single economic entity is itself significant. Moreover, the areas of U.S. cities and metro regions vary significantly, with Los Angeles significantly larger in physical terms than San Francisco, for example.
China’s 8-largest cities accounted for roughly 21% of GDP in 2009, while their U.S. peers accounted for nearly 30% of GDP in 2009. This reflects the higher degree of urbanization in the U.S. and the proportionately larger role that China’s rural economy plays in national economic growth. China’s large pool of rural consumers has substantial consumption potential, as evidenced by the strong auto sales in 2009 and 2010 during a period of generous government subsidies for rural car buyers.
Implications
In most countries, municipal economic problems are a national-level issue in the bigger cities and a local or provincial level problem in other cases. However, as the comparison with major U.S. cities shows, a number of major Chinese cities have enough economic heft to make the global top-50 national economies list. In short, this means that local financial problems, such as the more than US$1.6 trillion in debt that Chinese cities and local governments are estimated to hold, can quickly become global problems if the situation sours.


