Gabriel Collins, “Exploring Potential Limits to Gasoline Demand Growth in China,” China SignPost™ (洞察中国) 96 (13 June 2016).
Executive Summary:
–Gasoline will be China’s dominant passenger car fuel for the next decade, and likely beyond, due to gasoline’s superior power density and logistical advantages relative to pure electric cars and competing liquid fuels.
–But the gasoline will be burned more efficiently. Gasoline motors are being downsized and turbocharged and/or linked with electric propulsion systems to form more efficient gasoline-electric drivetrains that wring out significantly more miles per gallon while delivering high performance that makes driving fun.
–Lower kilometers driven per vehicle, drivetrain technology improvements, and a gradual increase in scrapping rates mean that by 2018, sales of new cars in China will likely need to be at least 10-to-15% higher than they were in 2015 simply to sustain the 2015 incremental gasoline demand growth rate of approximately 215 kbd.
Despite the high confidence expressed by the China gasoline bulls, three core structural factors deserve close scrutiny given their deep influence over how cars are, and will be able to be, driven in China now and in coming years. These factors are: (1) traffic problems, (2) potential changes in car owner sentiment and behavior driven by congestion and other issues, and (3) improvements in fuel efficiency from rising penetration of more advanced drivetrain technologies.
- Traffic Troubles
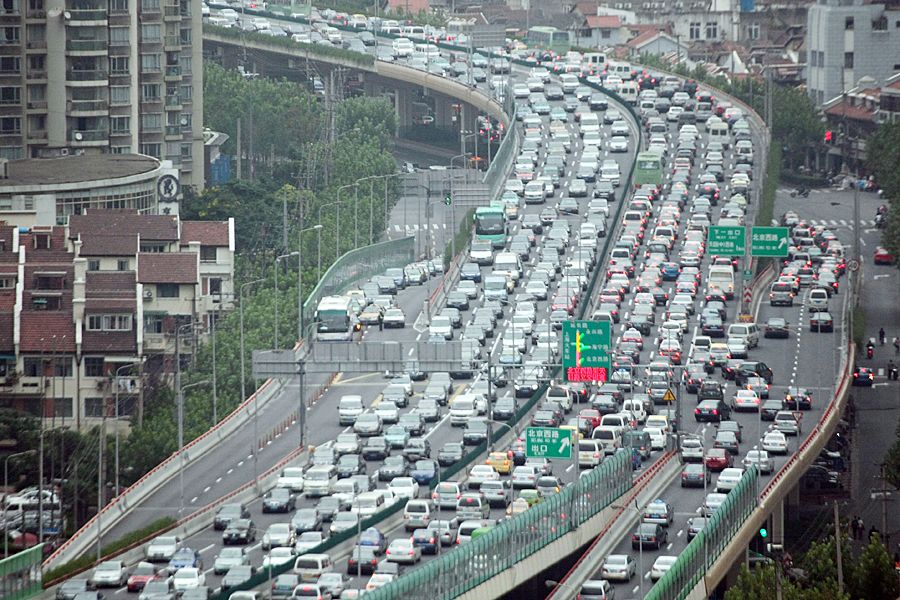
China’s terrible gridlock continues to worsen in many cities as car sales outpace highway construction. It is not yet fully clear what the “saturation” point is for vehicle ownership, but that tipping point is ultimately much more likely to be driven by a lack of road space than by any per capita car ownership threshold. The data from Beijing—China’s most mature car market—suggest that at around 200 cars per km of roadway, large Chinese cities will begin to see ownership rates level off (Exhibit 1).
Exhibit 1: Private Passenger Cars Per KM of Road in the Beijing and Chengdu Metro Areas
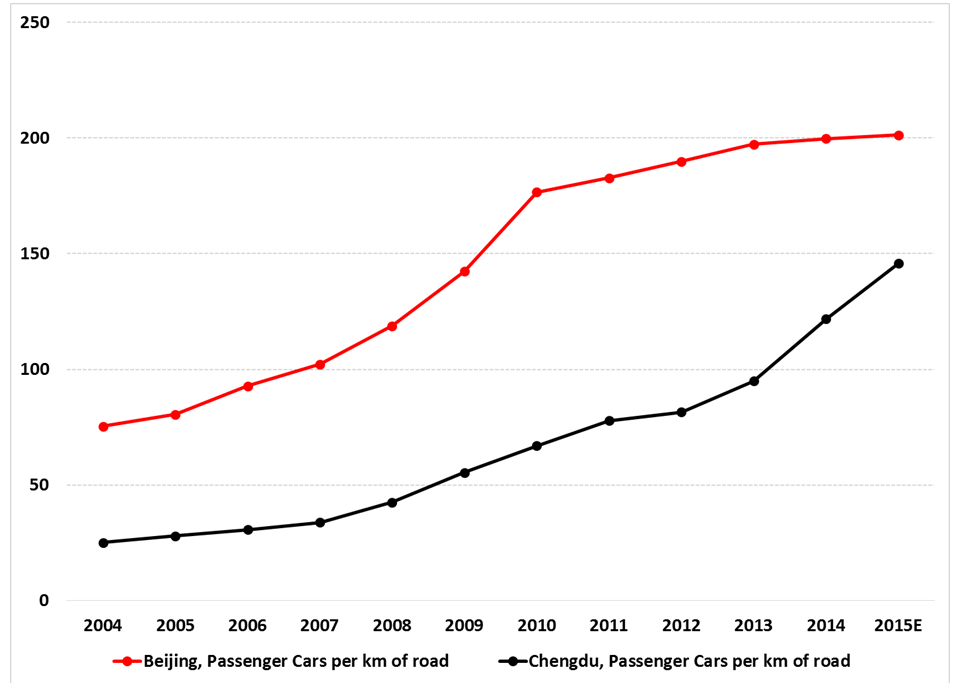
Source: Local Statistical Bureaus, NBS China
Urban consumers dominate the Chinese car market thus far, and so the national car density numbers are misleading, because they factor in rural areas where many residents still cannot afford cars. As the used car market grows in China, it is possible that rural areas could become a more significant source of fuel demand. But at this point and for the next five years, the proper focus will be on cities, as Tier 1 and 2 markets reach saturation and car sellers increasingly look to Tier 3-6 markets to prop up sales.[1]
To be sure, Beijing has imposed substantial restrictions on car purchases—for instance, setting an annual quota of cars that can be sold and issuing license plates via a lottery—as well as actual use of private passenger vehicles in the city.[2] Yet the trend of roadway saturation plateauing in the 200 cars per km range is likely fundamentally rooted in physical constraints, as opposed to administrative ones.
Such factors include low road density relative to populated area. For instance, a September 2013 study by Singapore’s Land Transport Authority reveals that Beijing had only 1.7 km of roadway per square kilometer of land area.[3] Contrast this with Seoul and Tokyo, who had 13.5 km/km2 of road and 19.1km/km2, respectively.[4] New York has 12.9 km of road per square kilometer.[5] Harris County, Texas has 263 passenger vehicles per km of road—30% higher than Beijing–but a road density of approximately 2.8 km/km^2, or 65% higher than Beijing’s.[6]
- Data Show World-Class Car Sales…And World-Class Congestion
Granular data reveal just how deep China’s traffic congestion problems are. TomTom, a leading global navigational aid manufacturer, uses an historical database with 14 trillion historical travel time measurements that is continually updated and measures congestion on the road networks of 295 cities in 50 countries around the world.[7] The index is expressed in the form of a percentage number that reflects the increase in travel time as compared to an uncongested “free flow” traffic situation.
TomTom’s 2016 Traffic Index yields two important insights. First, China’s large cities are already among some of the world’s worst in terms of traffic congestion. For instance, of the world’s 25 most-congested cities in 2015, five were located in China (Exhibit 2).
Exhibit 2: TomTom Global Cities Road Congestion Ratings
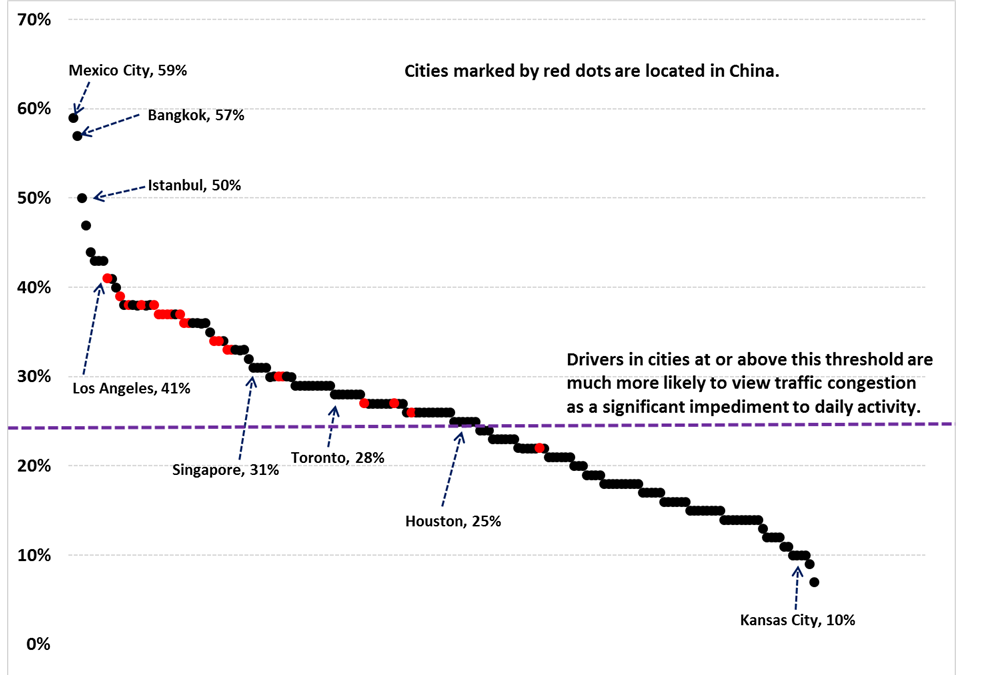
Source: TomTom, Author’s Analysis
Second, congestion worsened in 14 of the 22 Chinese cities appearing on the overall list, suggesting that the country’s traffic struggles will become more serious despite a slowing economy. Adding more color, 21 of the 22 Chinese cities on the list had worse average congestion readings than the city of Houston, Texas, which is legendary for its traffic issues. The 10 most congested Chinese cities in the TomTom dataset accounted for roughly one in every five passenger vehicles owned in China at year-end 2014, so many Chinese drivers are already in the thick of serious traffic jams that are not likely to improve in the next few years.
The TomTom data read like a “who’s who” of large and growing Chinese car markets. Key cities include: Beijing, Chengdu, Chongqing, Guangzhou, Nanjing, Tianjin, and Wuhan, as well as emerging car markets such as Changsha, Ningbo, Quanzhou, and Shijiazhuang. In short, congestion issues are not only plaguing the powerhouse coastal vehicle markets—they are also affecting key inland demand hubs.
- How Might Driver and Car Buyer Sentiments and Behavior be Changing in China?
China gasoline market analysts face the critically important question: how much do Chinese car owners actually drive? The question is a complicated one in practice because the Chinese government does not report vehicle miles travelled (“VMT”) data as, for instance, the US Department of Transportation does.[8] Researchers in China have worked to bridge this gap, using two primary methodologies.
The first entails using regularly reported total freight or passenger traffic volume to estimate VMT per vehicle.[9] The second method estimated the relationship between VMT and vehicle age and applied this to the vehicle age distribution of the Chinese vehicle fleet in a particular year.[10] An analysis from Argonne National Laboratory states that in the 2001-2004 period, the annual VMT of cars in China’s cities was between 24,000 and 27,000 km.[11] This number has likely fallen significantly in recent years, because the early estimates were inflated by the large proportion of taxis in China’s car fleet—16.4% of vehicles in 2002 and 10.1% in 2004.[12] The Argonne researchers project that by 2030, the average VMT of Chinese passenger cars will be 13,000 km—a figure more closely aligned with actual data from Japan and Western Europe in the late 1990s.[13]
Privately owned cars are coming to dominate China’s passenger car fleet and annual VMT per car continues to regress toward the 10,000-13,000 km level. Traffic congestion like that illustrated in the TomTom data could prompt drivers to use their vehicles less, a potentially deeply consequential factor for China’s future gasoline consumption trajectory. A 2015 study by consultancy Bain and Company showed that nearly a third of current car owners surveyed might get rid of their vehicles if traffic congestion became “significantly worse,” while such a congestion level would prompt nearly 30% of prospective car buyers to refrain from purchasing a vehicle.[14] Bain canvassed a reasonably large sample size, surveying more than 2,100 respondents in six Tier-1 and Tier-2 cities.
The survey’s question prompt relies on drivers’ subjective perceptions of how bad traffic is relative to the current conditions used as a baseline. But despite that potential weakness, it suggests that continued gridlock could retard vehicle sales, could prompt current owners to drive less, and in a worst case, could spark significant sales of vehicles in China’s largest metro areas—which also happen to be the major centers of gasoline demand.
Exhibit 3: Primary Bearish Factors That Could Reduce Car Ownership and/or Sales in China
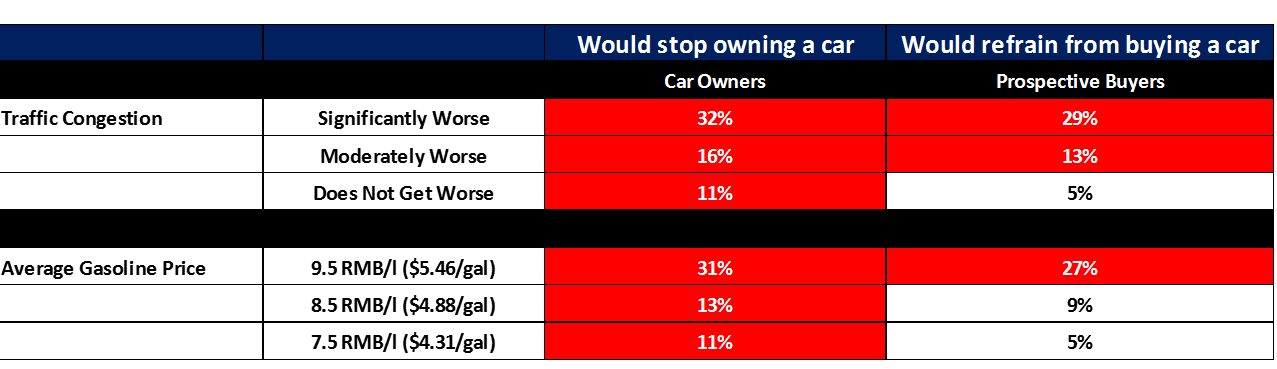
Source: Bain and Company, Author’s Analysis
Traffic problems are also much more likely to affect car use and sales (and thus, gasoline demand) than is the other key bearish factor: gasoline prices. Congestion affects drivers here and now and it impacts them every single time they drive anywhere beyond their immediate area of residence. Gasoline prices, in contrast only cause pain when a driver has to fill up—something that likely happens once per week or less. Secondly, changing global oil market conditions make it very unlikely that gasoline prices in China will rise high enough to negatively impact car ownership and sales.
Bain’s survey data suggests that the “pain point” for current and prospective Chinese drivers begins hen gasoline prices climb to 7.5 RMB a liter or higher ($4.31/gallon). The sharpest pain does not hit until prices climb above 8.5 RMB/l ($4.88/gallon). These thresholds are surprisingly high—particularly from an American perspective—and reflect the fact that Chinese vehicle owners are generally wealthier than average and that passenger cars are still a luxury good, rather than the daily necessity that they have become in other parts of the world.
To assess the risk that gasoline demand might pose to car sales and ownership rates in China, the author plotted China’s baseline retail gasoline price for #93 fuel against the daily spot price of Brent crude, the broad international crude oil price benchmark. The result suggests that it would take an oil price spike akin to that experienced in 2008 to drive Chinese retail gasoline prices to levels likely to adversely affect sales and ownership of personal cars. For instance, retail gasoline prices in China have historically not approached the 7.5 RMB/l mark unless Brent crude was trading at close to $120/bbl. The true pain threshold of 9.5 RMB per liter of gasoline would likely require Brent crude to trade close to $160 per barrel (Exhibit 4). The author is highly cognizant that a truly severe geopolitical shock—such as large-scale disruption of oil transit through the Strait of Hormuz by military conflict—could trigger price spikes of such magnitude. Yet such events also lie very far out on the probability curve.
Exhibit 4: China Retail Gasoline Prices vs. Brent Crude Daily Spot Price
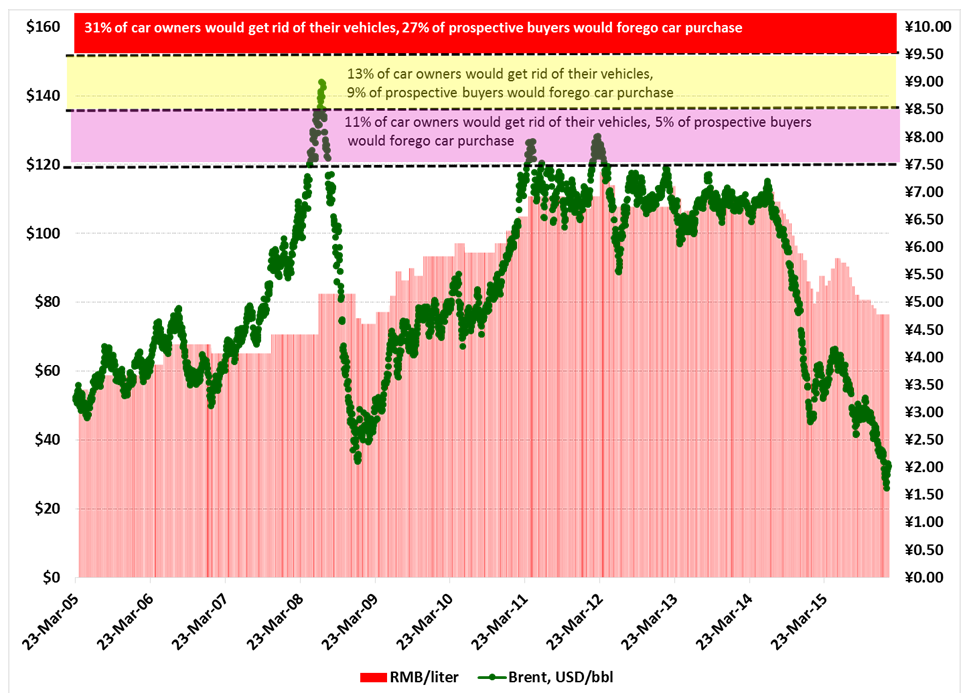
Source: EIA, NDRC, Chinese Media
The Bain survey data suggest that traffic congestion and gasoline prices will—by a significant margin—be the strongest influences on car purchase and use decisions in China. Of the three “secondary factors” surveyed, only one—taxi/ride sharing availability—comes close in terms of potential influence. If taxi availability were “easy,” 18% of respondents would consider getting rid of their cars, while 13% would consider doing so if it were “easy” to rent a car.
Two core conclusions flow from this data: first, there is indeed significant market space for the growth of car rentals and ride sharing in China, which would explain Uber’s intense drive to compete in the China market.[15] Second, there is a significant gap in the responses of car owners and prospective car buyers to the taxi and rental car availability questions, as well as the question aimed at gauging willingness to use public transport in lieu of a car. Those respondents who had not yet purchased a car were not nearly as influenced by rental/taxi availability.
China SignPost’s prior research suggests a possible explanation: prospective car buyers seek cars not just for social status reasons, but for practical ones as well.[16] For a person who seeks to carry groceries, travel in more comfort than public transport offers, and have personal transportation available at a time and place of their choice, a personal car fits the bill. But once such an individual buys the car and begins to face the burdens of car ownership in China—for instance, extreme difficulties finding parking space—the initial allure fades and a bit of buyer’s remorse kicks in.[17]
Exhibit 5: “Secondary” Bearish Factors That Could Impact Car Sales and Use in China
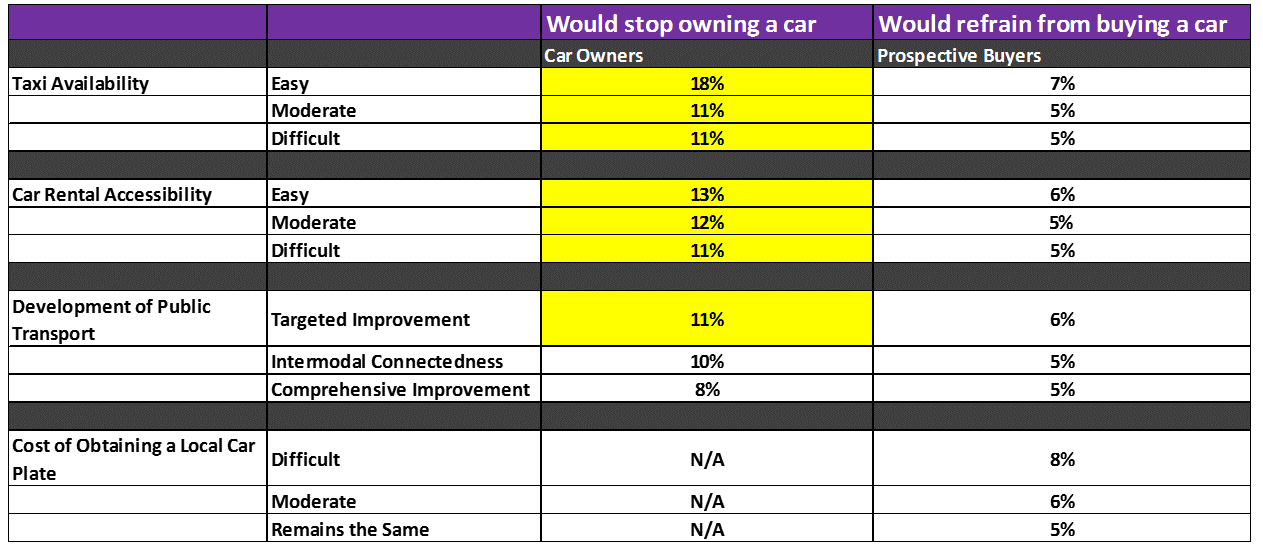
Source: Bain and Company, Author’s Analysis
- Key Factor: Evolving Powertrains
Over the past decade, SUVs have become increasingly popular in China and are the fastest growing passenger vehicle segment. Data from JATO Dynamics show that the rapid sales growth continues, with more than 4 million SUVs sold in China during 2014 and 6 million in 2015—accounting for nearly 1/3 of all passenger vehicles sold in the country.[18]
SUVs’ rapid penetration directly impacts gasoline consumption, since these vehicles tend to have higher-displacement engines that, all things held equal, generally consume more fuel than the motors used in smaller, lighter sedans. For instance, this author’s model for gasoline use per million vehicles indicates that a million small economy cars driven an average of 13,000 km per year create approximately 12 kbd of incremental gasoline demand. Yet a million midsize SUVs such as the Honda CR-V use 21 kbd of gasoline–75% more (Exhibit 6). To put the gasoline numbers in perspective, to produce a barrel of gasoline, Chinese refiners typically must run approximately 3.8 barrels of crude oil.
Exhibit 6: Estimated Incremental Gasoline Demand Per Million Vehicles, kbd
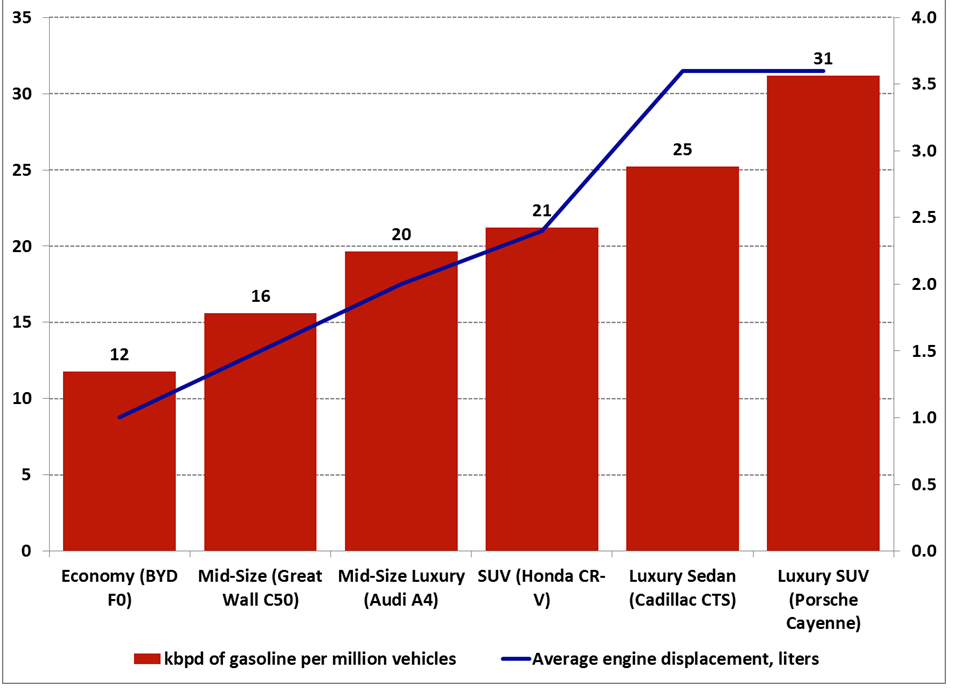
Source: Company Reports, Author’s Analysis
Strong SUV sales may make it difficult for China to meet its ambitious national fuel economy standards, which call for an average fleet fuel use of nearly 48 miles per gallon (“mpg”) by 2020. China released Phase IV fuel consumption standards for passenger vehicles (GB19578-2014) in December 2014 and the rules took effect on January 1, 2016.[19] The Phase IV standards use a curb-weight index to establish maximum fuel consumption limits and determine compliance based on the corporate-average fuel consumption (CAFC) of manufacturers in a given year. There are two sets of limit values: one for regular cars and another for special cars.
To put China’s 2020 fuel economy standards in perspective, US regulators seek a fleet-wide standard of 38.9 mpg for light-duty vehicles and 44.8 mpg for cars.[20] The difficult part is that as a local car culture takes hold, Chinese consumers increasingly seek vehicles that are fuel-efficient but also powerful and fun to drive. For instance, in 2014, Honeywell Turbo Technologies surveyed visitors to auto.163.com and yangche51.com, two of China’s most popular automotive news and information portals (combined daily traffic of 340,000) to gauge consumer expectations of new vehicles coming to market.[21]
Only 1/3 of respondents were satisfied with their current vehicle’s fuel economy and power, while 80 percent would seek fuel economy savings of at least 10 to 30 percent to be satisfied with their next vehicle purchase. Furthermore, 94 % of respondents indicated engine performance was an “important” or “very important” factor for purchasing a vehicle and 68% of respondents said they would prefer to buy a smaller car if it could still perform like a vehicle with a larger engine.[22]
Results such as these suggest Chinese drivers may follow a path at least somewhat akin to American drivers, who place a significant premium on powerful vehicles. In the U.S. market, manufacturers responded strongly to drivers’ dual demand for miserly mileage and generous horsepower, as fleet-wide average fuel economy doubled between 1975 and 2014 and average horsepower per vehicle rose nearly 50% (Exhibit 7).
Exhibit 7: Fuel Economy and Horsepower Both Improved Dramatically in US Car Fleet Over The Last 40 Years
Average horsepower per vehicle (left axis), average miles per gallon (right axis)
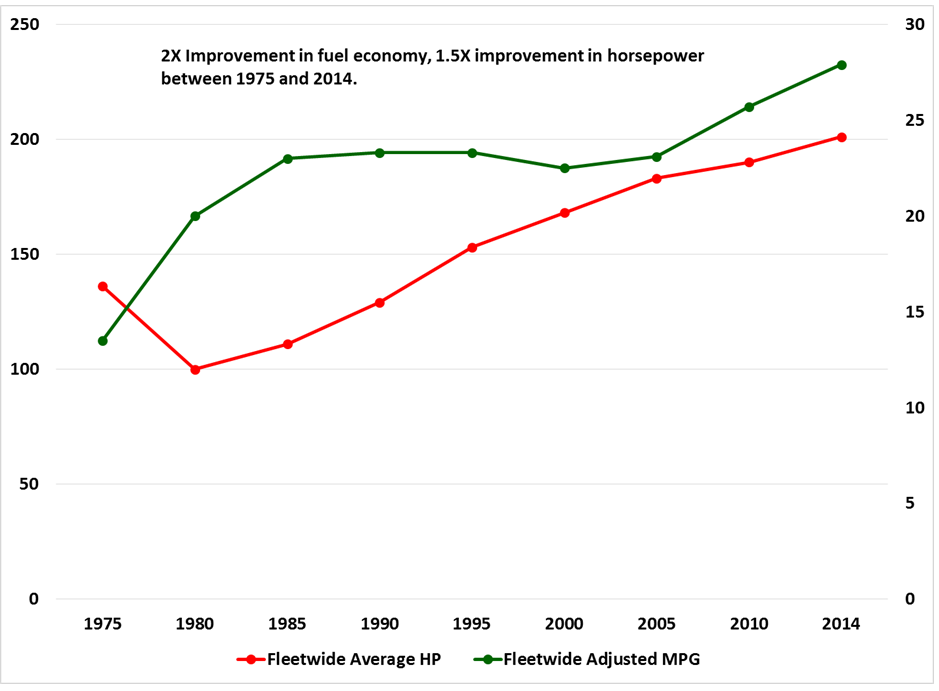
Source: NHTSA, Author’s Analysis
The U.S. auto sector’s ability to balance fuel economy and power output demands has been remarkable and contrasts sharply with the EU vehicle fleet, where fuel economy clearly won out over power. Indeed, comparing 2011 EU passenger vehicle fleet data (the latest available) to the 2010 numbers from the US showed that the typical European passenger car got 57% better mileage than its US equivalent, but had 61% less horsepower.[23] The chief difference appears to be in the vehicles’ powertrains, as the typical European vehicle was only 14% lighter than its US counterpart—likely insufficient to explain the substantial fuel economy and power disparities.
Cars Sold in China Will Increasingly Use Turbochargers and Partial Hybrid Propulsion To Balance Fuel Economy and Power Output Demands
China’s car fleet is likely to be increasingly permeated by powertrain technologies that enhance fuel economy without detracting from vehicle performance. There are three primary ways of accomplishing this, each of which must balance equipment cost and user convenience. First is to move towards a fully electric vehicle fleet. The second is to make engine displacement smaller and use turbochargers to maintain power levels. The third is to incorporate partial electric vehicle technologies—“mild hybrids” in industry parlance.
Pure electric vehicles are at a disadvantage for several reasons. To begin with, fully electric cars likely will not reduce China’s severe air pollution burden and will simply trade “air security” for “oil security.”[24] Despite the rapid growth rate in wind and solar generation capacity, China still relies overwhelmingly on coal-fired plants to generate its electricity. As such, electric cars simply shift pollution problems from a semi-dirty tailpipe to a potentially much more emissions-intensive power plant smokestack.
Each million plug-in electric passenger cars would likely create an additional 740,000 tonnes per year of coal demand in China—equivalent in CO2 emissions terms to approximately one million BYD F0 passenger sedans.[25] Moreover, burning coal also releases far more sulfur than burning an equivalent amount of gasoline, not to mention mercury and other toxics not typically emitted in meaningful amounts by gasoline engines.
This “road to grid” linkage increases coal demand and air pollution and could disrupt local electrical grids where there are higher concentrations of such cars. Additionally, EV infrastructure likely cannot be easily or cheaply socialized and hence will represent a barrier to entry for consumers. Expenses, inconvenience, range limitations, and the costs of chargers and other supporting systems fall on the individual owner whereas the costs of liquid-fuel infrastructure like gas stations are distributed across society because so many people use them.[26]
As such, China—like other major global markets—is most likely to continue using gasoline propulsion for passenger vehicles. But powertrains will adopt much different configurations than drivers are currently accustomed to. In short, the use of smaller engines with turbocharging and mild hybrids will continue growing rapidly.
Turbochargers enable engines to generate significantly more power from smaller displacements, which preserves performance while increasing fuel economy. For instance, data from Honeywell indicates that a 2.0 liter turbocharged four cylinder engine can generate the same horsepower as a 3.0 liter six-cylinder motor, while using 25% less fuel and emitting 20% less CO2.[27] At present, roughly one in four cars in China uses turbocharging, but this penetration rate is expected to climb to nearly 50% by 2020.[28] Dozens of cars sold in China now incorporate turbochargers, as evidenced by the Auto Shanghai 2015 show, where more than 50 vehicles using turbochargers were on display.[29]
“Mild hybrids” are a compromise technology that use a 48-volt electric system (vice the standard 12-volt auto battery) to boost fuel efficiency by assisting the car’s initial acceleration and also powering auxiliary systems such as air conditioning. Data suggest that mild hybrids can deliver fuel economy gains of approximately 15%, but at only about a third the cost of a full hybrid system.[30] Large Chinese carmakers such as Geely and FAW plan to begin selling 48-volt mild hybrids within the next two years.[31] Furthermore, A123 Systems, a leading global battery maker owned by Wanxiang Group says “we see all major Chinese auto makers on or sourcing 48-volt batteries” and that they will phase such systems in over the next three years.[32]
As vehicles with turbochargers and 48-volt mild hybrid technology come to comprise a larger portion of China’s vehicle fleet, the incremental gasoline demand of each million vehicles sold could decline by 15-to-20%, assuming mileage and driving habits remain constant. The effects in 2016 and 2017 will be more muted, but potentially still material. This author believes China’s gasoline demand will feel the full impact of more efficient propulsion technologies in the 2019-20 timeframe. Accordingly, a key question will be: “does numerical growth in car sales remain strong enough to power overall annual gasoline demand growth in the 200 kbd range despite cars becoming more fuel-efficient?” The next analysis will assess recent passenger vehicle sales trends in China, as well as potential growth trajectories moving forward.
[1] Gabriel B. Collins and Andrew S. Erickson, “Gasoline Alley: How Much Gasoline Demand Are Each Million Cars Sold in China Worth?” China SignPost™ (洞察中国) 82 (3 November 2014), http://www.chinasignpost.com/2014/11/03/gasoline-alley-how-much-gasoline-demand-are-each-million-cars-sold-in-china-worth/
[2] “Beijing Said to Expand Restrictions on Vehicle Use to Fight Smog,” Bloomberg, 8 January 2016, http://www.bloomberg.com/news/articles/2016-01-08/beijing-said-to-expand-restrictions-on-vehicle-use-to-fight-smog
[3]Pan Di, “Key Transport Statistics of World Cities,” Journeys, September 2013, http://www.lta.gov.sg/ltaacademy/doc/13Sep105-Pan_KeyTransportStatistics.pdf
[4] Ibid.
[5] Ibid.
[6]Texas DMV Registration Data by County, CY2014, http://www.txdmv.gov/reports-and-data/cat_view/13-publications/25-reports-data/65-vehicle-titles-registration/229-number-of-vehicles-registered; “Harris County Profile,” The County Information Program, Texas Association of Counties, http://www.txcip.org/tac/census/profile.php?FIPS=48201 (accessed on 20 May 2016)
[7] “TomTom Traffic Index, Measuring Congestion Worldwide,” 2015, http://www.tomtom.com/en_gb/trafficindex/
[8] C.Y. Cynthia Lin, Jieyin (Jean) Zeng, “The Elasticity of Demand for Gasoline in China,” Department of Agricultural and Resource Economics, UC Davis, http://www.des.ucdavis.edu/faculty/lin/China_gasoline_elasticity_paper.pdf (25)
[9] He, K., Huo, H., Zhang, Q., He, D., An, F., Wang, M., Walsh, M., 2005. Oil consumption and CO2 emissions in China’s road transport: current status, future trends, and policy implications. Energy Policy, 33 (2005) 1499–1507
[10] Lin, X., Tang, D., Ding, Y., Yin, H., Ji, J., 2009. Study on the Distribution of Vehicle Mileage Travelled in China. Research of Environmental Sciences, 22(3).; See also Oliver et.al, “In-use Vehicle Emissions in China:
Beijing Study,” Belfer Center for Science and International Affairs, Harvard University, March 2009, http://belfercenter.ksg.harvard.edu/files/2009-05-ETIP-Oliver-et-al-2.pdf
[11] M. Wang, D. He, H. Huo, and L. Johnson, “Projection of Chinese Motor Vehicle Growth, Oil Demand, and CO2 Emissions through 2050,” December 2006, Argonne National Laboratory, https://greet.es.anl.gov/files/rwdz78ca
[12] Id.
[13] Id.
[14]“China New Mobility Study: 2015,” Bain & Company, http://www.bain.com/Images/BAIN_DIGEST_China_new_mobility.pdf
[15] Leslie Hook, “Saudi wealth fund takes $3.5bn Uber stake,” Financial Times, 1 June 2016, http://www.ft.com/intl/cms/s/0/a7e31c58-282c-11e6-8b18-91555f2f4fde.html#axzz4B1qWnLw7
[16] Gabe Collins and Andrew Erickson, “Counting Cars: Rising Private Automobile Ownership in Chinese Cities Paves Road for Gasoline Demand,” China SignPost™ (洞察中国) 71 (24 June 2013), http://www.chinasignpost.com/2013/06/23/counting-cars-rising-private-automobile-ownership-in-chinese-cities-paves-road-for-gasoline-demand/
[17] Gabe Collins and Andrew Erickson, “Dying for a Spot: China’s Car Ownership Growth is Driving a National Parking Space Shortage,” China SignPost™ (洞察中国) 17 (10 January 2011).
[18]“FOCUS ON CHINA. 2015 MARKET OVERVIEW: IMPACTS AND OPPORTUNITIES OF CAR PURCHASE RESTRICTIONS,” JATO, March 2016, http://www.jato.com/wp-content/uploads/2016/04/JATO-Market-Focus-China-Car-Purchase-restrictions-and-Market-overview-2015-Final.pdf
[19] “China: Light Duty-Fuel Consumption,” transportpolicy.net, http://www.transportpolicy.net/index.php?title=China:_Light-duty:_Fuel_Consumption.
[20] “Light-duty vehicle” means a passenger car or passenger car derivative capable of seating 12 passengers or less. 42 U.S.C. 7401 https://www.gpo.gov/fdsys/pkg/CFR-2011-title40-vol19/pdf/CFR-2011-title40-vol19-sec86-1803-01.pdf.
[21] “Eighty Percent of Chinese Drivers Seek Fuel Economy Improvements with Next Vehicle Purchase, Survey Says,” Honeywell, 2 July 2014, https://turbo.honeywell.com/whats-new-in-turbo/press-release/eighty-percent-of-chinese-drivers-seek-fuel-economy-improvements-with-next-vehicle-purchase-survey-says/.
[22] Shrinking vehicle dimensions while preserving performance may also be driven by the scarcity of parking space in China. See, for instance, Gabe Collins and Andrew Erickson, “Dying for a Spot: China’s car ownership growth is driving a national parking space shortage,” China SignPost™ (洞察中国), No. 17 (10 January 2011).
[23]“EUROPEAN VEHICLE MARKET STATISTICS: Pocketbook 2014,”The International Council on Clean Transportation, http://www.theicct.org/sites/default/files/publications/EU_pocketbook_2014.pdf
[24] Aibing Guo, “Teslas May Be Making Hong Kong’s Pollution Worse,” Bloomberg, 13 April 2016, http://www.bloomberg.com/news/articles/2016-04-14/hong-kong-teslas-linked-to-more-co2-emissions-than-gasoline-cars
[25] Based on data from “Carbon Dioxide Emissions Coefficients,” EIA, 2 February 2016, https://www.eia.gov/environment/emissions/co2_vol_mass.cfm. 1.854 tonnes of CO2 emitted per tonne of sub-bituminous coal burned. Burning one gallon of gasoline emits 8.89 kg of CO2, which means 373 kg per barrel, or 3.17 tonnes of CO2 per tonne of gasoline (8.5 barrels per tonne of motor gasoline). 1.9 million tonnes of sub-bituminous coal emits 3.52 million tonnes of CO2, the same as 1.1 million tonnes of gasoline or 26 kbd annualized.
[26] Gabriel B. Collins and Andrew S. Erickson, “China Car Sales: New Pockets of Opportunity,” China SignPost™ (洞察中国) 79 (29 December 2013. http://www.chinasignpost.com/2013/12/29/china-car-sales-new-pockets-of-opportunity/.
[27] Honeywell Corporation, Investor Presentations, 2 March 2016 Investor Presentation, http://investor.honeywell.com/Events-and-Presentations.
[28] Id.
[29] “Honeywell Plans Turbo Future in China; More than 50 Vehicles Highlighted at Auto Shanghai 2015,” 14 May 2015, http://www.honeywell.com/newsroom/news/2015/05/honeywell-plans-turbo-future-in-china-more-than-50-vehicles-highlighted-at-auto-shanghai-2015
[30] Mike Ramsey, “China’s Car Makers Pioneer ‘Mild Hybrids’”, The Wall Street Journal, 8 March 2016, http://www.wsj.com/articles/china-car-makers-pioneer-mild-hybrids-1457433002 ; See also Continental Corporation Investor Presentation, 2 February 2016, http://www.continental-corporation.com/www/download/portal_com_en/themes/ir/events/20160202_hsbc_sri_ffm_en.pdf (Slide 13)
[31] Ibid.
[32] Ibid.