As China reports strong national GDP growth for 2010 (10.3%), we think it is interesting and worthwhile to see how the economic output of China’s provinces individually compares to those of national economies around the world in both aggregate and per capita terms. Our analysis uses nominal GDP data since the Chinese government, to the best of our awareness, does not publicly report purchasing power parity (PPP) adjusted data on the provincial level.[1]
This note provides a portrait that takes readers beyond the oft-resorted to conception of China as a monolithic behemoth of economic activity. We think this portrait helps reflect the magnitude of economic activity in different regions of China.
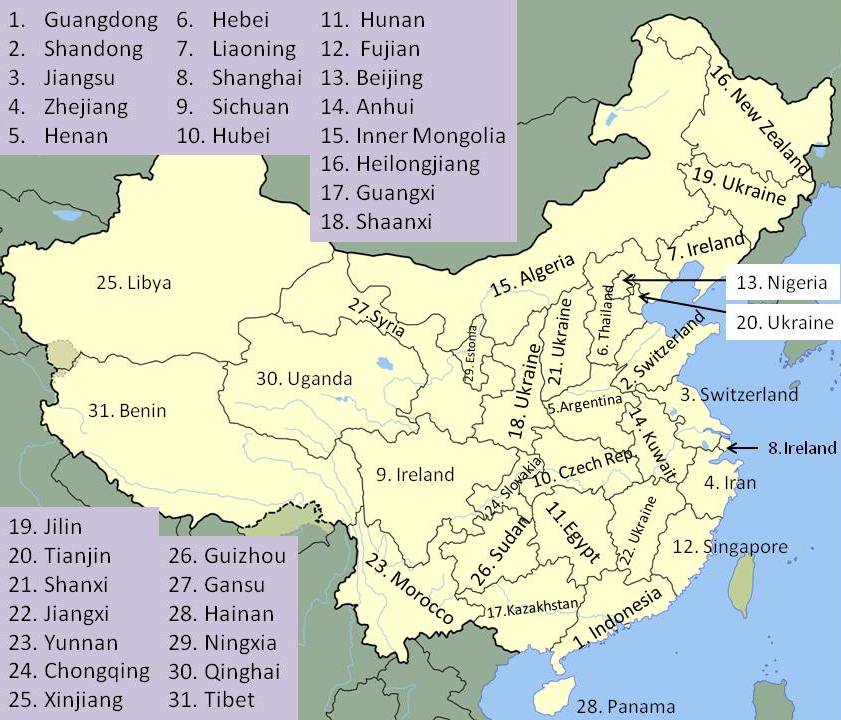
Exhibit 1: Nominal GDP by province and most comparable national economy, 2009, provinces numbered in shaded key

Source: World Bank, NBS China, Maps of the World, China SignPost™
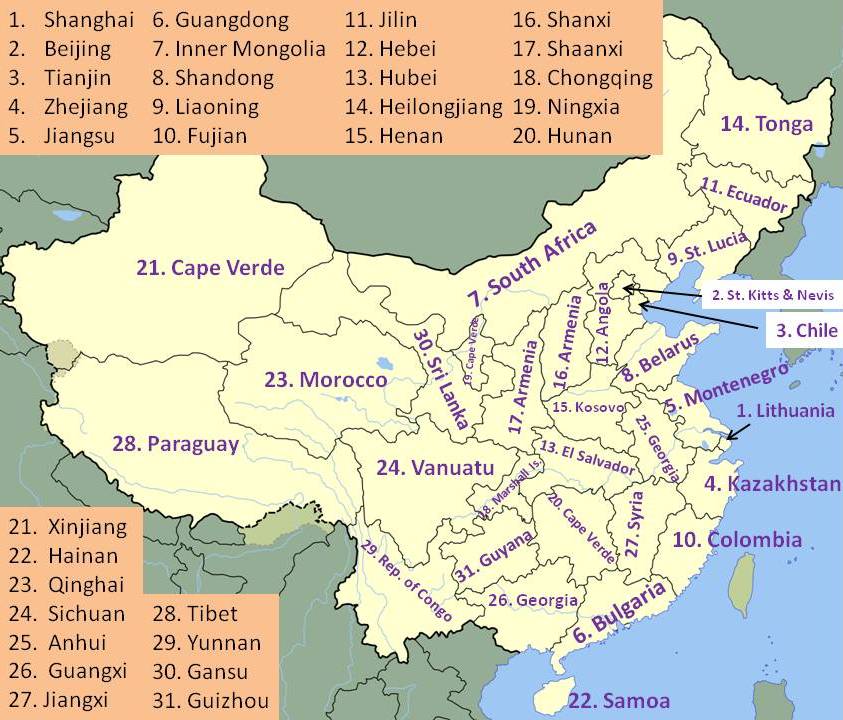
Exhibit 2: China per capita GDP data by province and closest foreign economy equivalents (nominal, 2009), provinces numbered in shaded key
Source: World Bank, NBS China, Maps of the World, China SignPost™
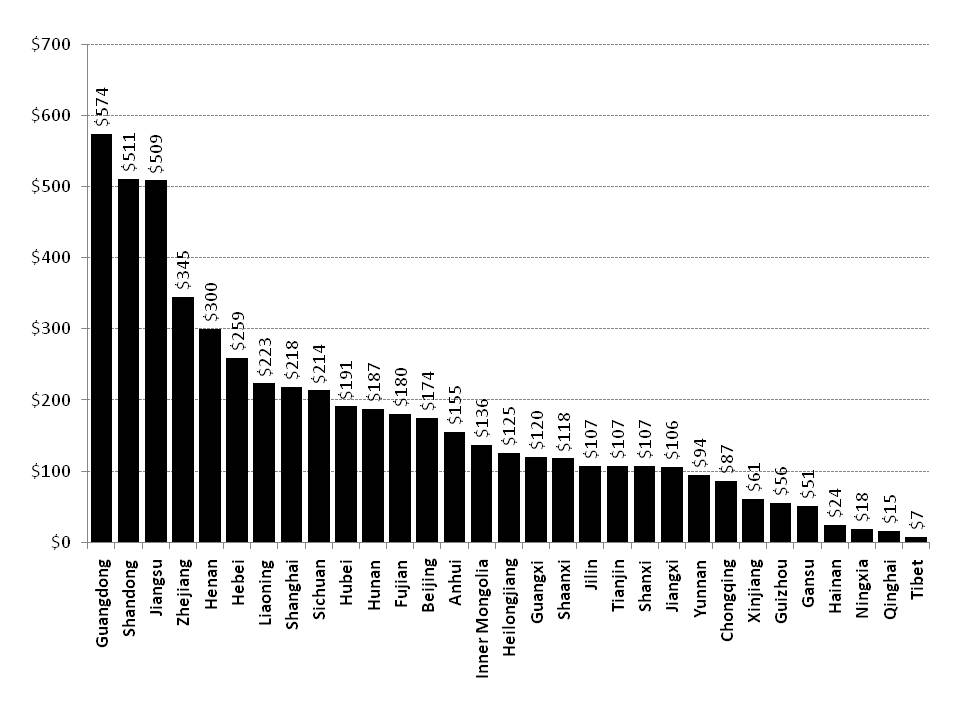
In 2009, Guangdong, Shandong, and Jiangsu all had provincial GDP of between US$574 billion and US$508 billion in 2009. The closest national economies to this range are Indonesia (US$540 billion) and Switzerland (US$491 billion). The remaining Chinese provinces have GDPs ranging from US$345 billion for Zhejiang, whose economy approximates Iran’s in size, to Tibet at US$6.6 billion, which has roughly the GDP of Benin.
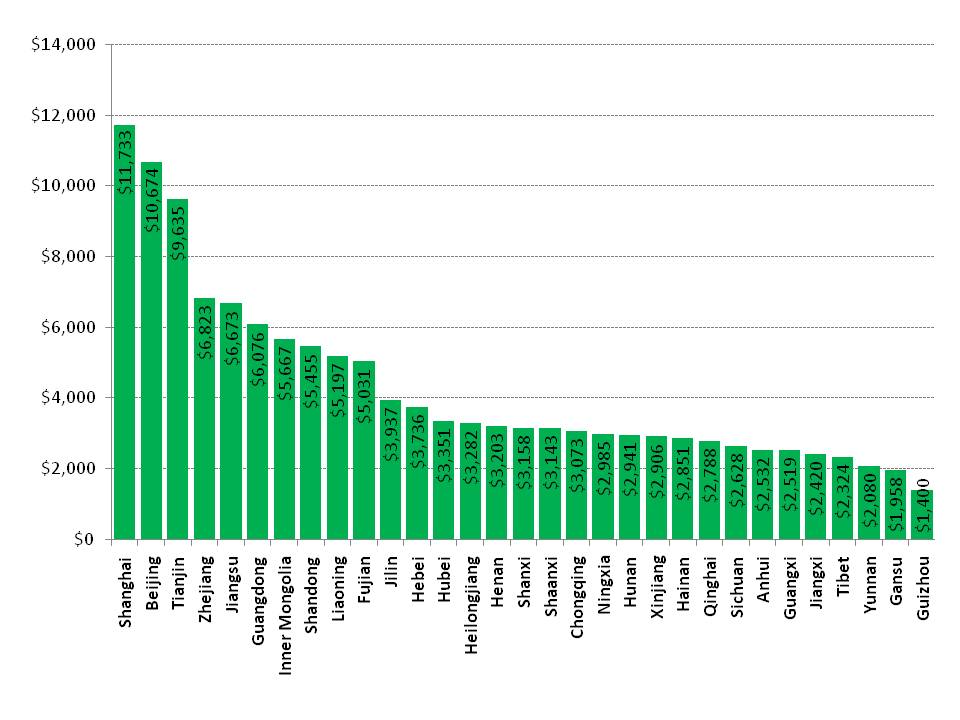
Exhibit 2 shows per capita nominal GDP figures for all of China’s provinces and municipalities. In per capita terms, Shanghai was the richest Chinese administrative region in 2009, with per capita GDP of US$11,733, followed by Beijing (US$10,674 and Tianjin (US$9,635). The provinces of central China[2], a high-population and high-potential area for future robust economic growth, had an average per capita GDP of just under US$3,000, in the range of Cape Verde and Tonga. The region had an aggregate nominal GDP of US$1.2 trillion in 2009, roughly equivalent to the GDP of Russia. Exhibit 3A and Exhibit 3B provide the breakdown figures for aggregate GDP by province (nominal, 2009) and per capita GDP by province, respectively.
Sichuan’s aggregate GDP is roughly the same size as that of Shanghai, which has less than ¼ the population. This disparity suggests that China’s Central region will remain a strong growth area for commodity and consumer goods demand for a number of years to come. A key implication is that providers of natural resource, construction equipment, autos, and other goods will need to consider focusing their China sales strategies on the regional pockets with the strongest demand potential.
Implications
Despite China’s strong economic growth over the past three decades, the country’s nominal per capita GDP level remains much lower than those of the other largest global economies. If China aspires to achieve a nominal national per capita GDP of even ¼ that of the U.S (~US$47,000), the remaining room for growth is massive, a reality that transcends the incessant focus on tenths percentage points in forecasts of China’s GDP. Achieving such a benchmark would require China to reach a nominal national per capita GDP slightly higher than that of Shanghai today.
The only regions of China that currently enjoy an income level in the US$12,000 –to-$9,000 range are the municipalities of Shanghai, Beijing, and Tianjin, which account for only about 4% of the country’s population. As the other 96% of China’s population continues to seek a modern consumer lifestyle, the potential for further natural resource demand growth is considerable and will deserve close attention since many key raw materials already face geological and other constraints that hinder supply expansions.
Exhibit 3A: China aggregate GDP by province (nominal, 2009)
Billion USD
Exhibit 3B: China per capita GDP by province (nominal, 2009)
USD
Source: NBS China, China SignPost™
[1] Along with data availability concerns, key factors that would affect PPP valuation of China’s GDP such as inflation and currency valuation are moving targets and problematize cross-country comparisons.
[2] Hebei, Hubei, Anhui, Henan, Sichuan, Chongqing, and Jiangxi.


